Autofig Size Modes
import autofig
import numpy as np
import matplotlib.pyplot as plt
#autofig.inline()
x = np.linspace(0,0.1,11)
y = np.full_like(x, 0)
s as float vs array
style = {'marker': 'o', 'linestyle': 'none', 'xpad': 0}
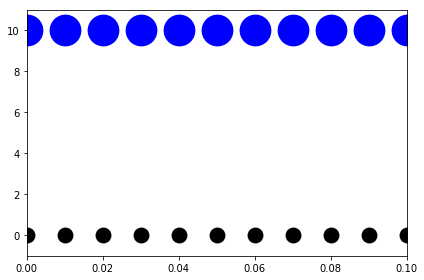
When setting the size (via the 's' dimension) as a float, that value is used directly according to the size-mode.
autofig.reset()
autofig.plot(x, y, s=0.05, **style)
autofig.plot(x, y+10, s=0.1, **style)
mplfig = autofig.draw()
However, when sending an array (or list), the values are mapped according to smap before being scaled according to the size-mode.
autofig.reset()
autofig.plot(x, y, s=np.full_like(x, 0.05), **style)
autofig.plot(x, y+10, s=np.full_like(x, 0.1), **style)
mplfig = autofig.draw()
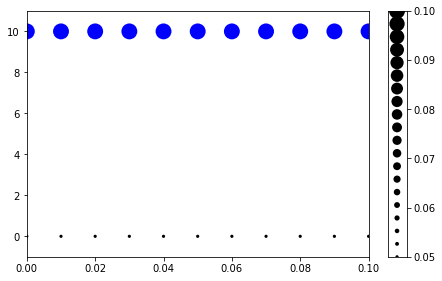
Here even though we're sending the same 0.05 and 0.1 as above, are rescaled according to the default smap of 0.01 to 0.05.
autofig.gcf().axes.ss[0].smap
(0.01, 0.05)
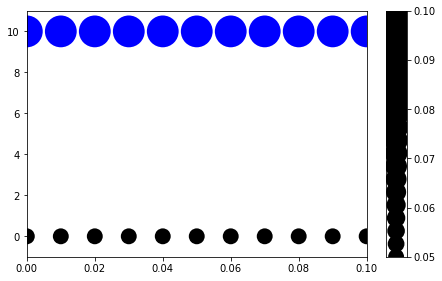
This smap scaling can of course be changed by manually sending a tuple.
autofig.reset()
autofig.plot(x, y, s=np.full_like(x, 0.05), smap=(0.05,0.1), **style)
autofig.plot(x, y+10, s=np.full_like(x, 0.1), smap=(0.05,0.1), **style)
mplfig = autofig.draw()
smode
The values in the 's' dimension (after mapping, if applicable) are then rescaled onto matplotlib's pixel scale based on the provided value of 'smode'. There are a number of accepted values for smode:
- 'pt' - the mapped value is passed directly to matplotlib and will have the same size on the screen regardless of zoom/figuresize
- [dimension(s)]:[figure/axes]:fixed - the mapped value is rescaled according to the size of the figure or axes in the given dimension/dimensions, but then remains fixed regardless of the zoom/figuresize
- [dimension(s)]:[figure/axes]:current - the mapped value is rescaled according to the size of the figure or axes and is updated when zooming or resizing the figure based on the current axes limits. This means when zooming in an interactive matplotlib window, the points will keep a fixed size on the screen but when resizing the figure, the points will react.
- [dimension(s)]:[figure/axes]:original - the mapped value is rescaled according to the size of the figure or axes and is updated when zooming or resizing the figure based on the original axes limits. This means when zooming in an interactive matplotlib window, the points will keep a fixed size in data unit and will therefore appear larger when zooming in.
Where dimension(s) can be one of: * 'x' * 'y' * 'xy'
By default, smode is 'xy:figure:fixed'
style1 = {'marker': 'o', 'linestyle': 'solid', 'xpad': 0}
Here we'll plot s=0.1 for several different size modes
autofig.reset()
autofig.plot(x, y, s=5, smode='pt', color='black', **style)
autofig.plot(x, y-10, s=0.1, smode='x:figure:fixed', color='blue', **style)
autofig.plot(x, y-20, s=0.1, smode='x:figure:current', color='red', **style)
autofig.plot(x, y-30, s=0.1, smode='x:figure:original', color='green', **style)
mplfig = autofig.draw()
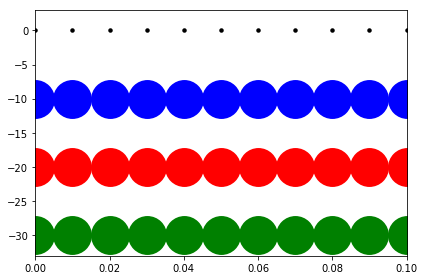
Besides 'pt', there is no obvious difference between 'fixed', 'current', and 'original' until resizing the figure interactively. Here we can fake zooming in on the plot by setting the x-limits externally (in matplotlib instead of autofig).